I support your projects with robust data analysis, statistical modeling, and insightful visualizations – from raw data to ready-to-publish results. For research, business, and data-driven decision-making.
Descriptive Statistics
Inferential Statistics
Regression & Correlation
Multivariate Analysis
Bayesian Statistics
Nonparametric Methods
Monte Carlo
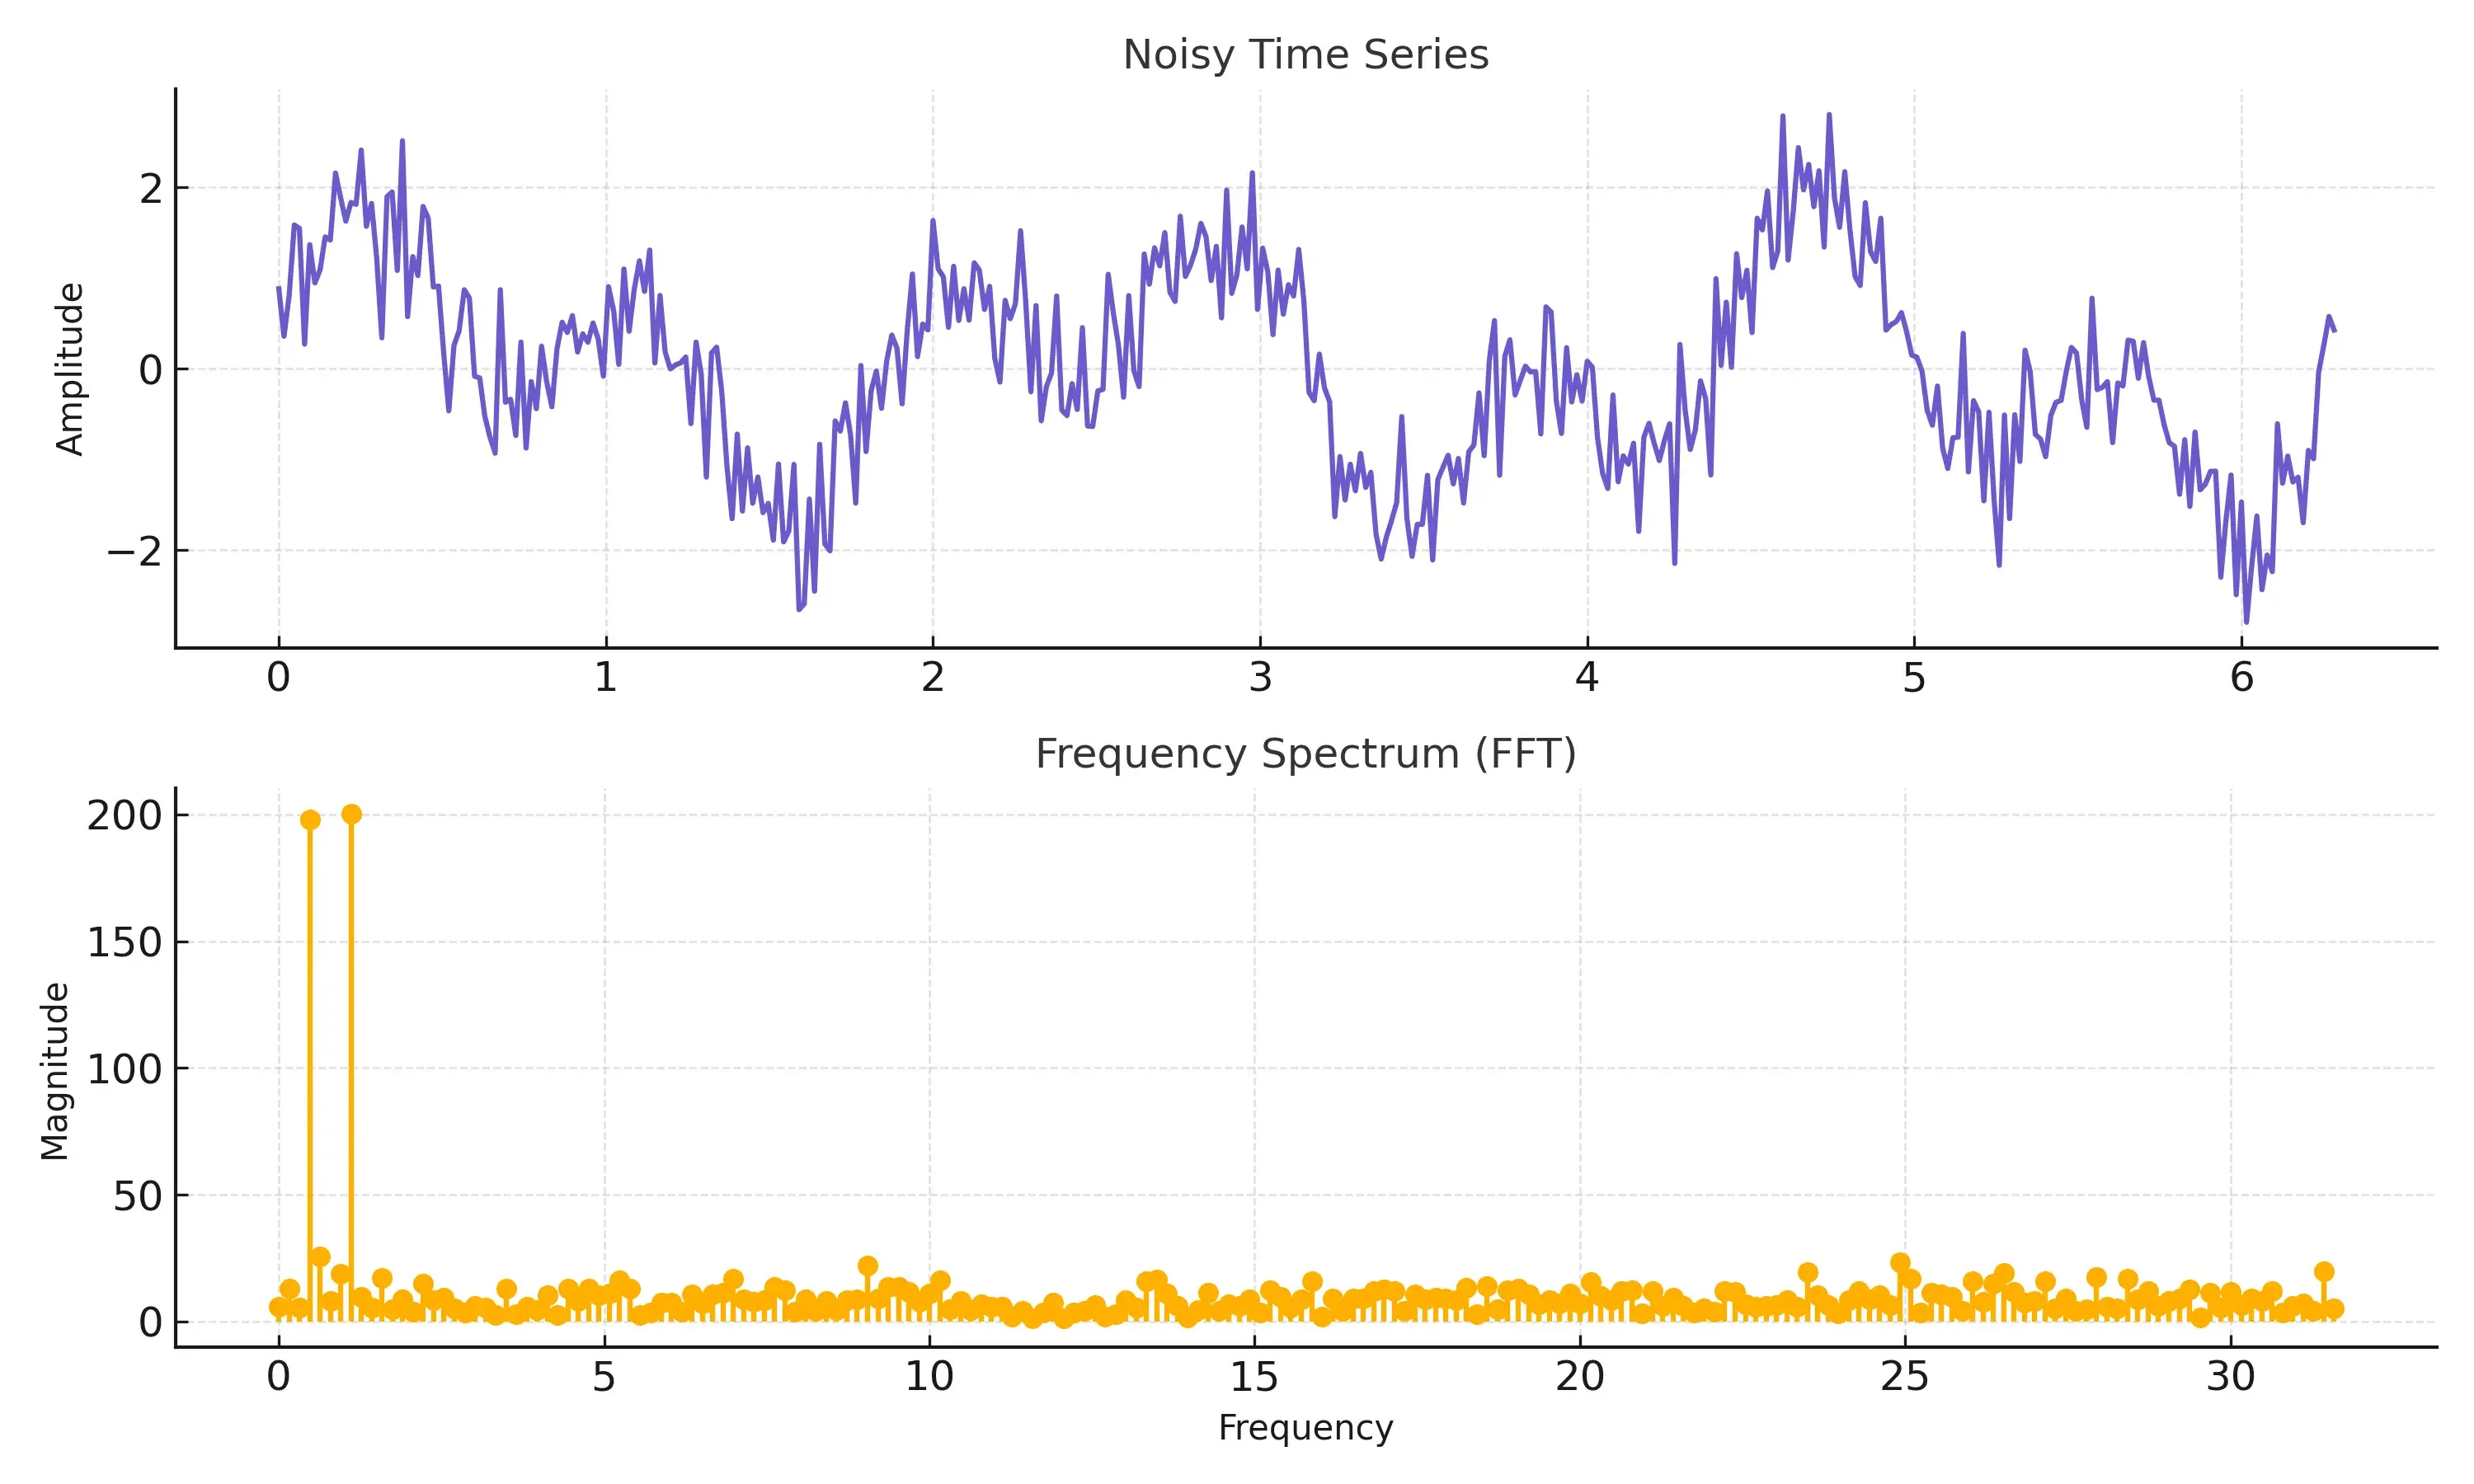
Fourier Methods
Hilber Transform
Visualization (ggplot2, seaborn, matplotblib)
Data is often noisy, complex, and overwhelming. Extracting reliable insights requires rigorous statistical methods and the ability to reduce complexity without losing essential structure.
To apply sound analytical techniques that uncover patterns, validate hypotheses, and communicate findings clearly – through intuitive visual representations and transparent statistical reasoning.

Accessible, insight-driven reports, visual dashboards, and publishable-quality graphics – enabling data-based decisions, stakeholder understanding, and scientific credibility.